Transactional Email Analytics: Delivery Tracking, Open Rates, and Bounce Monitoring
Every transactional email moves through a status lifecycle -- pending, sent, delivered, opened, clicked. Here is how to track every stage, monitor bounces and complaints, and use per-template analytics to keep your critical emails healthy.
On this page · 7
Why Tracking Matters
Marketing emails are important. Transactional emails are critical. When a customer clicks “Reset Password” and the email does not arrive, they cannot access their account. When an order confirmation vanishes, customers flood your support team. When a two-factor authentication code bounces, your security flow is broken.
Unlike marketing emails — where a 25% open rate is considered good — transactional emails should be reaching 95%+ of recipients. If they are not, something is wrong, and you need to know about it immediately. That is why transactional email analytics are not a nice-to-have. They are operational visibility into a critical part of your application.
Without tracking, you are flying blind. A customer says they never received their receipt? You have no way to verify. Bounces are creeping up? You will not know until your sender reputation is already damaged. A template change broke the layout and nobody is clicking? The problem will persist until someone manually checks.
Email Status Lifecycle
Every transactional email sent through Brixus365 — whether via the REST API or SMTP — moves through a series of statuses. Understanding these statuses is the foundation of transactional email analytics. Each status transition is recorded with a timestamp, giving you a complete audit trail of every email’s journey.
Email Status Lifecycle
Every transactional email moves through these states
Pending
Email accepted by Brixus365, queued for sending
Sent
Handed off to the mail delivery infrastructure
Delivered
Recipient mail server confirmed receipt
Bounced
Recipient mail server rejected the email (hard or soft bounce)
Failed
Delivery failed permanently (invalid config, quota exceeded)
Opened
Tracking pixel loaded — recipient viewed the email
Clicked
Recipient clicked a tracked link in the email
The happy path is Pending → Sent → Delivered → Opened → Clicked. Bounced and Failed are terminal states that branch off after Sent. Status transitions are tracked with timestamps for full audit trails.
The most important thing to understand about the lifecycle is that not every email reaches every status. The “happy path” is Pending, then Sent, then Delivered, then Opened, then Clicked. But emails can branch off at any stage: a delivery attempt might bounce, a delivered email might never be opened, and an opened email might never generate a click. Each of these outcomes tells you something different about your email health.
Terminal vs progressive statuses
Bounced and Failed are terminal statuses — the email will not progress further. Delivered, Opened, and Clicked are progressive — an email that has been clicked was also necessarily opened and delivered. This means your delivery rate should always be higher than your open rate, which should always be higher than your click rate. If these relationships are inverted, something is misconfigured.
The Analytics Dashboard
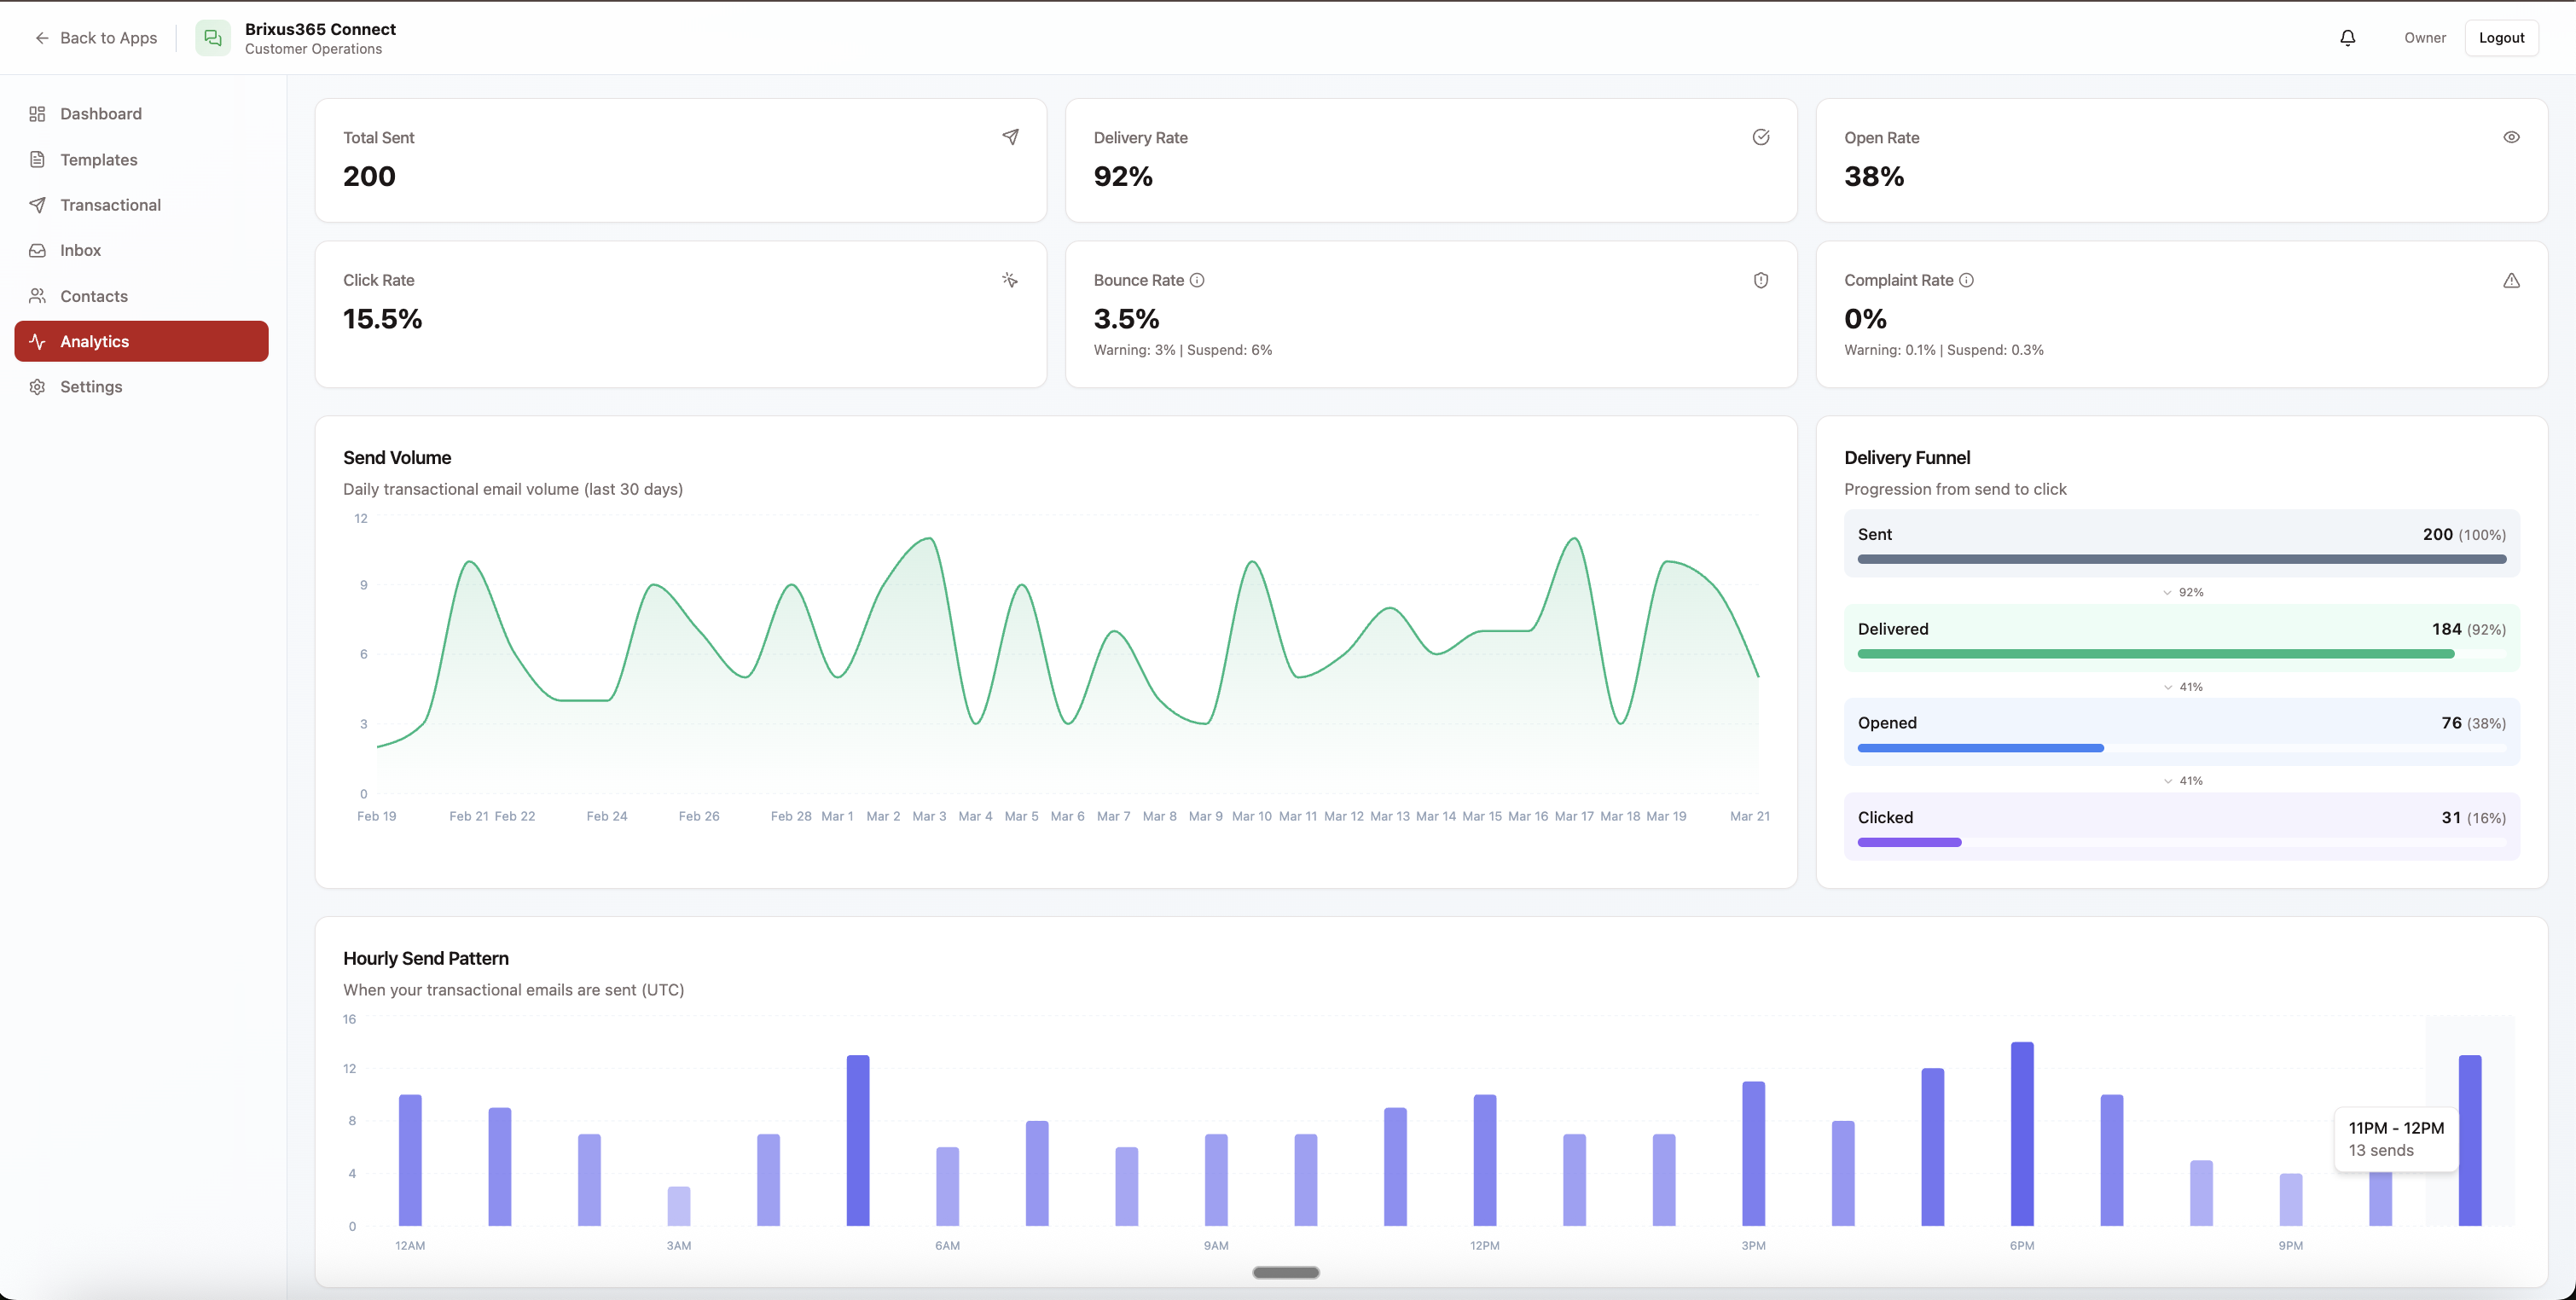
The transactional email analytics dashboard gives you three levels of visibility: aggregate overview stats, daily volume trends, and per-template breakdowns. Together, these views let you answer the questions that matter: Are my emails getting delivered? Are recipients engaging with them? Which templates need attention?
Aggregate stats
The top-level stats show total emails sent, delivery rate, open rate, bounce rate, and complaint rate for your selected time period. Each metric includes a comparison to the previous period, so you can spot trends at a glance. A delivery rate below 98% or a bounce rate above 2% are warning signs that deserve investigation.
Daily volume chart
The volume chart shows sends per day over your selected date range. This is useful for spotting anomalies — a sudden spike might indicate a bug sending duplicate emails, while a sudden drop might mean your application stopped sending. For applications with predictable patterns (e-commerce peaks on weekends, SaaS signups on weekdays), the chart helps you verify that reality matches expectations.
Per-template breakdown
The template table shows delivery rate, open rate, and click rate for each template. This is where you identify underperformers. If your “Password Reset” template has an 89% open rate but your “Welcome Email” is at 58%, the welcome email likely needs attention — maybe the subject line is too generic, or the email is landing in the Promotions tab.
Open and Click Tracking
Open and click tracking are the engagement signals that tell you whether your transactional emails are not just arriving, but being read and acted upon. Both are enabled by default on all transactional emails sent through Brixus365.
How open tracking works
When Brixus365 sends an email, it embeds a tiny, invisible tracking pixel — a 1x1 transparent image with a unique URL — at the bottom of the email. When the recipient opens the email and their email client loads the image, Brixus365 records the open event with a timestamp, IP address, and user agent. This is the industry-standard method used by every email analytics platform.
Brixus365 tracks both total opens (every time the email is opened) and unique opens (whether the email was opened at all). A customer might open their order confirmation three times to check the tracking number — that is three total opens but one unique open.
How click tracking works
When Brixus365 processes an email for sending, it rewrites every link to pass through a tracking redirect. When the recipient clicks a link, the request hits Brixus365 first (recording the click event), then redirects to the original URL. The redirect happens in milliseconds — recipients do not notice the intermediary step.
Each click event records the original URL, timestamp, IP address, and user agent. This gives you a full click audit trail: which links are being clicked, when, and by whom. For transactional emails with calls-to-action (tracking links in shipping notifications, account verification buttons), click data tells you whether the email is achieving its purpose.
The Delivery Pipeline
Every email is tracked through each stage automatically
Send
Your app calls the API or sends via SMTP
Delivered
Recipient mail server accepted the email
Opened
Tracking pixel loaded in the email client
Clicked
Recipient clicked a tracked link
Not every email reaches every stage. Bounced emails stop at “Send” and are tracked separately. Emails without open tracking enabled skip the “Opened” stage.
Bounce and Complaint Monitoring
Bounces and complaints are the two signals that can damage your sender reputation — and by extension, the deliverability of every email you send. Monitoring them is not optional.
Hard bounces vs soft bounces
A hard bounce means the email was permanently undeliverable — the address does not exist, the domain is invalid, or the recipient server has permanently blocked your domain. Hard-bounced addresses should never be emailed again. Brixus365 automatically suppresses hard-bounced addresses to prevent repeated delivery failures.
A soft bounce means a temporary delivery failure — the recipient’s mailbox is full, the server is temporarily unavailable, or the message was too large. Brixus365 automatically retries soft bounces with exponential backoff. If retries fail after multiple attempts, the soft bounce is promoted to a hard bounce.
Spam complaints
A spam complaint occurs when a recipient marks your email as spam in their email client. Even though transactional emails are expected by the recipient, complaints still happen — sometimes because the recipient does not recognize the sender name, sometimes because they cannot find the information they need and report the email out of frustration.
Brixus365 tracks complaints via SES feedback loops and displays them in the analytics dashboard. A complaint rate above 0.1% is a red flag. If your complaint rate is rising, review your sender name (is it recognizable?), subject lines (are they clear?), and email content (is it what the recipient expected?).
Per-Template Analytics
Aggregate metrics tell you whether your transactional email system is healthy overall. Per-template analytics tell you which specific email types are performing well and which need attention. This is where you go from “our delivery rate is 99.2%” to “our order confirmation delivery rate is 99.5% but our welcome email is only 98.1% — let us investigate.”
What to look for
For each template, the analytics dashboard shows:
- Delivery rate — Should be 98%+ for all templates. Below that, investigate DNS configuration, content issues, or recipient quality.
- Open rate — Varies by email type. Password resets should be 80%+, receipts 60%+, shipping notifications 60%+. Low open rates suggest subject line or sender name issues.
- Click rate — Only meaningful for templates with calls-to-action. A shipping notification with a tracking link should have a high click rate. An invoice receipt may have a low click rate and that is fine.
Identifying underperformers
Sort templates by delivery rate to find emails that are not reaching recipients. Sort by open rate to find emails that arrive but are not being read. Sort by click rate to find emails where the call-to-action is not compelling. Each sort order reveals a different type of problem.
When you find an underperformer, the fix usually falls into one of three categories: a technical issue (DNS, authentication, content triggering spam filters), a design issue (subject line, sender name, email layout), or a relevance issue (the email is not useful to the recipient). Analytics tell you there is a problem — investigating the specific emails and their content tells you what the problem is.
Frequently Asked Questions
Is tracking automatic for all transactional emails?
Can I disable open tracking for specific emails?
How long is analytics data retained?
Does SMTP get the same analytics as the REST API?
Can I get real-time alerts for delivery issues?
How accurate is open tracking?
Can I export analytics data?
Track every transactional send end-to-end
Webhooks, message-level event timelines, and aggregate dashboards from the same engine.